About me.
My name is Sean, I am an Epidemiologist working for the UBC and BC
Centres for Disease Control in Vancouver, British Columbia. My recent work focuses on COVID-19 variant severity.
My background includes various research roles related to health in academia, industry and volunteer positions, with a focus in
methodology, data / statistical analysis and academic writing. I have a passion for health science research, reproducible
research and data science, specifically data analysis and data visualisation.
Experience
I currently conduct research related to COVID-19 variants of concern (VOC) severity at the
BC Centre for Disease Control (BCCDC).
Our work uses large administrative databases to understand how these VOCs impact disease severity. Specifically, my
projects have been focused on VOC severity and how social determinants of health (e.g., income, education) can affect disease
severity.
My role is on focused on the design and methodology of research projects, data and statistical analysis, and scientific writing. This includes:
- Conceptualising and conducting all aspects of epidemiologic research studies (i.e. hypotheses, study population, methodology, analysis, etc.)
- Leading the statistical analysis in R: this includes exploratory analyses as well as creating data analysis pipelines from tidying raw data, applying a causal framework to analysis and modelling severity by using more complex analyses like propensity scores, inverse probability treatment weights and mediaion techniques
- Leading the scientific writing of manuscripts for internal use and for publication in scientific journals

Our research was concentrated in occupational health and safety oh health workers, specifically in relation to COVID-19. During this role,
I worked on two main projects: Physician Occupational Health and Safety (POSH) Unit in Vancouver Coastal Health and with the
WHO Collaborating Centre at UBC.
POSH focused on providing a primary surveillance database for all physicans in Vancouver at the
start of the pandemic. The was the first of its kind in the city and helped keep doctors safe during the beginning stages of the pandemic.
The WHO collaborating Centre project was more focused on research. We collaborated with WHO teams in Siwtzerland to analyse a study of
international healthworkers to better understand their perception of occupational safety during the pandmic.
- WHO Collaborating Centre:
- I co-lead a study in collaboration with the World Health Organization (WHO) which surveyed health care workers from around world about health risk and protection measures in the workplace during the pandemic, and understood how this was related to econimc indicators.
- Conceptualisaiton of study and perfomed data analysis
- Collaboration with international team members
- POSH: Created a database of all physicians to collect data on COVID-19 exposures and test results to monitor physicians/healthcare workers in Vancouver
throughout the pandemic.
- Automated daily surveillance data from mlutiple hospitals to streamline data collection
- Created weekly reports summarising COVID-19 infections and symptoms in the physcian population in Vancouver


Our research group studied how different characteristics of the urban environment may be associated with cancer risk, physical
activity and obesity. We used British Columbia’s largest cohort, the British Columbia Generations Project, to
study epidemiological links between how different measures of the urban environment, like walkability, green
space and air pollution impact cancer risks and health. We also studied how the built environment can affect
cancer-causing behaviours.
My role as a research assistant was to conduct literature reviews and research in the
field, and contribute to the statistical analysis and writing academic papers.
- Conducting analyses on a large prospective cohort
- Scientific writing, including abstracts, literature reviews, reports and manuscripts
- Completion of my Master's Thesis which analysed the association between breast cancer risk related to the built environement (namely, traffic-related air pollution, residential greenness and walkability) in post-menopausal women. My thesis was recognised by a number of significant awards listed in the recognition seciton below.
During my time as a research associate at Broadstreet Health Economic and Outcomes Research, I gained in-depth experience in the design and execution of various types of epidemiological studies with a focus on systematic reviews and meta-analyses. My research experience included co-leading a systematic review on lysosomal acid lipase deficiency and have co-authored a meta-analysis published in the Journal of Managed Care Pharmacy.
- Conducting a systematic literature review and network meta-analysis from beginning to end, including abstract review and data extraction
- Active participation in team meetings with pharmaceutical clients in relation to the research projects
- Since this position, I have continued my education in the feild of HEOR, taking short courses and certificates in:
- Decision modeling for Health Economic Evaulation
- Meta-anlaysis concepts and analysis
Publications
I have co-authored several publications on a wide array of topics including COVID-19 variant severity, breast cancer risk,
and drug effecivess. In many of these analyses I am the first author, and led the analysis and writing.
Check out my CV for a full list of my publicaitons.
View all publications
The section below will provides a brief example of my programming skillset using publicly available data taken from the Government of Canada webiste. In this example I will walk through data preparation, data visualisation and reporting techniques, and provide three deliverables:
- A data visualisation of COVID-19 in Canada in 2021
- A dashboard of COVID-19 in Canada over the pandemic
- A report of COVID-19 in Canada in 2021
Data can be complicated to understand, therefore being able to provide concise and easy to understand data visualisations is key
to data exploration and in final manuscripts and deliverables. I have a passion for creating appealing and informative
figures to better help interpret the data.
The COVID-19 pandemic produced large amounts of data. In the example figure below, I tried to summarise the pandemic from
a Canadian perspective in a single figure. I have created this figure below using ggplot2 in R. This was figure was made using public data from
Government of Canada.

Sometimes a static image isn't enough to tease apart the data. In this case an interactive dahsboard may be
the solution. I enjoy bringing my figures to life by creating web app dashboards using Shiny in R.
The dahsboard below was created in R using Shiny and was styled using CSS. The dashboard allows the user to
look at infections, vaccination and mortality rate by specific province and year. Again, the data was taken from
the Government of Canada website.
Analysis is only one aspect of good research. The other important aspect is being able to commucate the results effectively.
When working on a project, I focus on building an efficient workflow with the final product being an automated report /
manuscript to easily share the results with colleagues. This allows small changes to the study population inclusion criteria
or statistical anlayses to be easily implemented and to create an updated report.
I have a passion for coding and using a variety of tools to accomplish my work efficiently. I have experience with a variety of languages and have used them in many projects, but my language of choice for analysis is R. To me, reproducibility is key, so optimising my code and workflow is always a priority.
Recognition
I have recieved a number of significant awards for my work, including my MSc thesis, academic standing and other initiatives. These awards include national, provincial and univeristy-level recognition.

CIHR CGSM-M
Award for MSc Thesis (2020)
The Canadian Institute for Health Researchs's (CIHR) Canada Graduate Scholarships – Master’s (CGSM) program provides financial support to high-calibre scholars.
This is a national-level award gieven to 3,000 Master's students researching health. I was a recipient of this award for my
Thesis on brest cancer risk associated with the built environement in post-menopausal women in BC.

Laurel L. Watters Research Fellowship
Award for MSc Thesis (2020)
This fellowship if awarded to a deserving graduate student or medical resident in the Faculty of Medicine engaged in research into the
causes, treatment, and cure of breast cancer. Mr. Watters passed away in 2002. The awards are made on the recommendation
of the Faculty of Medicine, and in the case of graduate students, in consultation with the Faculty of Graduate and
Postdoctoral Studies.

Dr. Yassi & Team recognised for COVID-19 initiative
Early in the COVID-19 pandemic, Dr. Yassi's team was called upon by Vancouver Coastal Health (VCH) to assist with occupational health of VCH health workers and to create and manage a unit focused on the occupational needs of physicians. Sean was the primary data analyst on this team.
Read More Description
Donna Gibson Prize
The Donna Gibson Memorial Prize are made on recommendation of the School of Population and Public Health, UBC, to the graduating student with the highest grade.
See more
George Elliot Fellowship
The George Elliott Fellowship in Community Heath is made on recommendation of the School of Population and Public Health to the student who contributed significanlty to the community health during their time at UBC. I have the recipient of this award due to my contributions in with the Gloabl Health initiaive and the COVID-19 healthworker surveillance.
See moreVolunteer
Volunteering has always been important part of my life. I have been lucky enough to have been part of two amazing global health projects since the beginning of my Master's program at UBC, and continue to work on these projects today. Both projects are part of UBC's Global Health Initiative, and aim at giving back to local communities, as well as targeted research to provide a long-lasting impact.
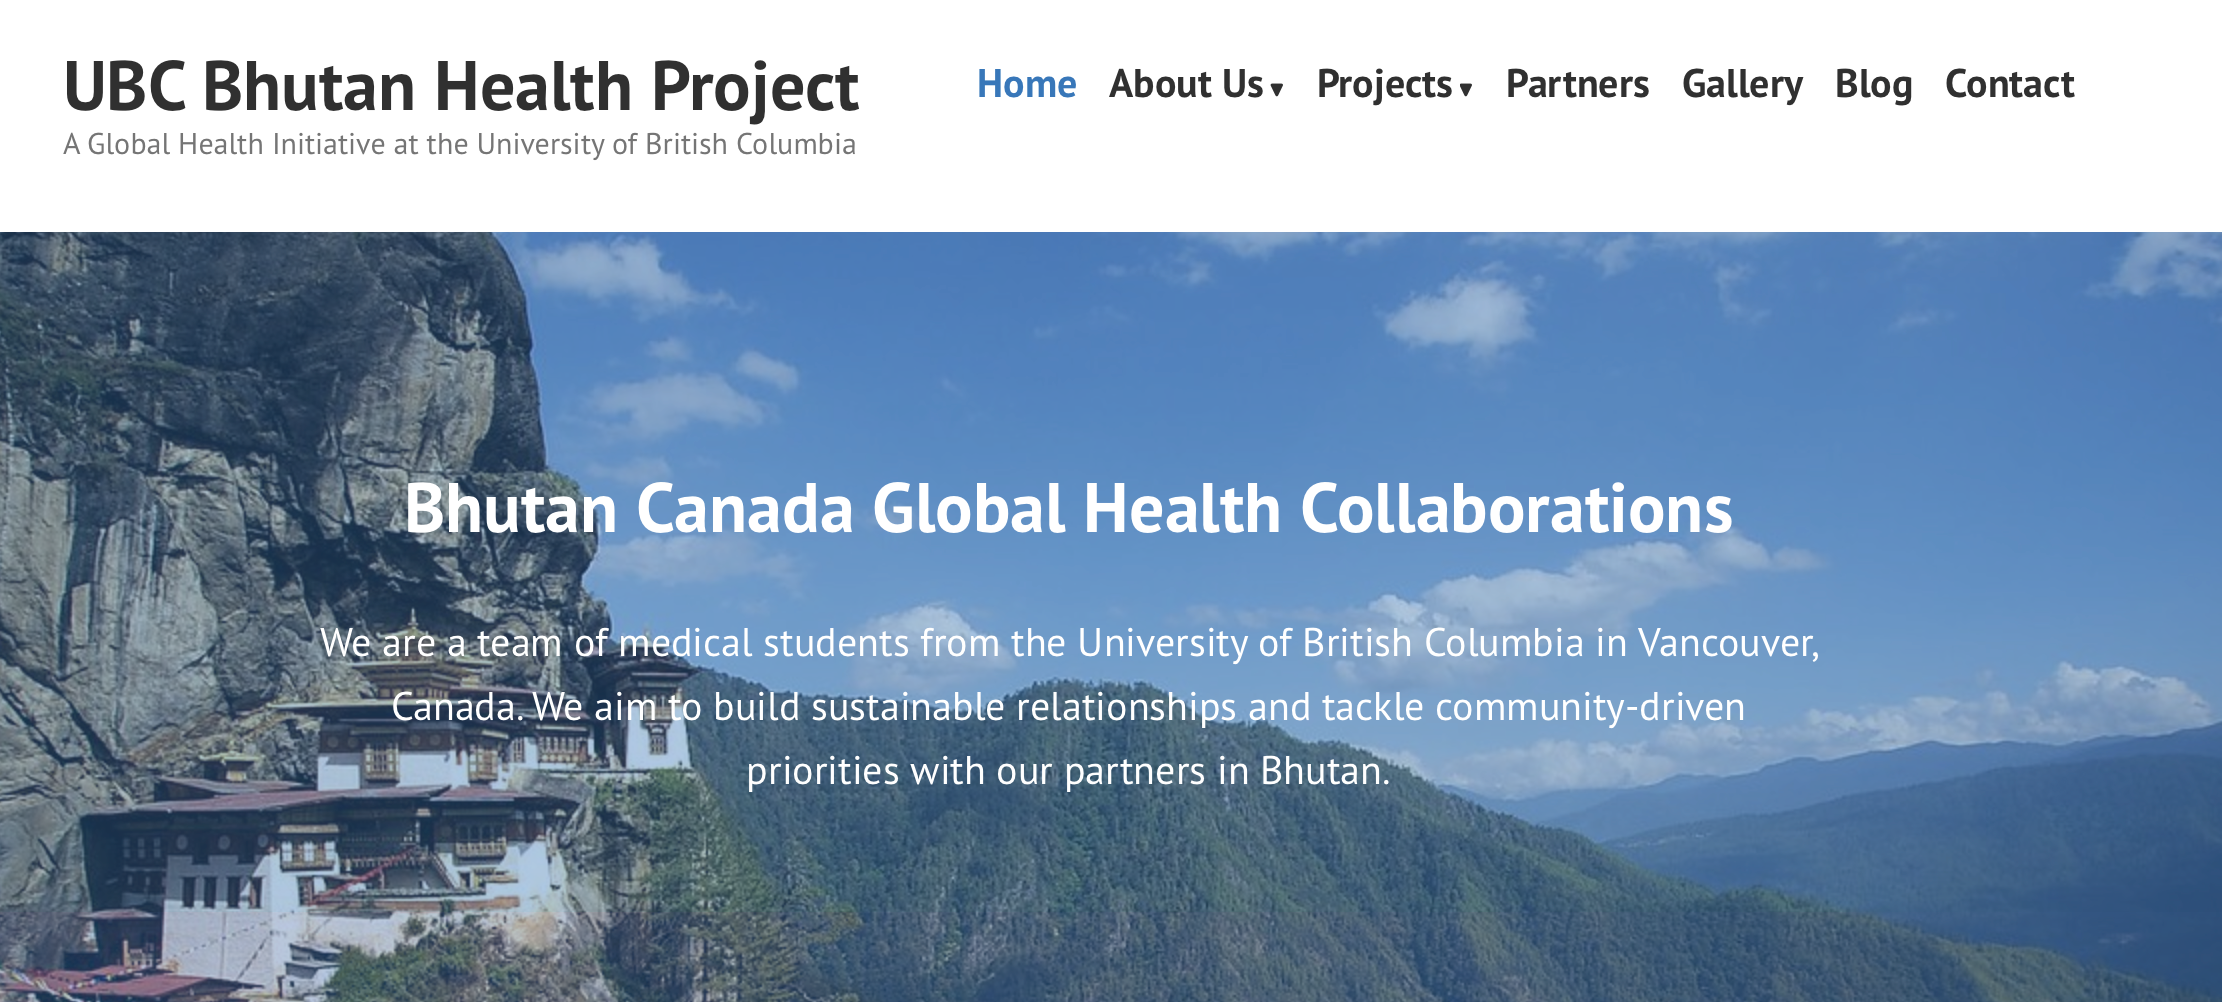
UBC Bhutan Mental Health Project
Research Study
Team Member
2021 - present
The goal of this initiative is to better understand the dynamics of youth mental health in Bhutan. This project in in partnership with a medical school in Bhutan and UBC department of Medicine. My role has been in been in writing the research protocol, applying for research ethics and funding as well as in the creation of a research survey for students in Bhutan to better understand mental health needs. I have also been leading the analysis of the research project. For more information on this project, visit our website.